

Technical Analysis Tools for Long-Term Investing


Before keeping a foot in the mysterious world of stocks, it's important to equip yourself with an understanding of its varying aspects (minor and major). To recognise whether a stock is priced accurately and predict its next possible move, a technical analysis of shares is done. Investors and analysts are able to depict a stock's next step, whether it's an upward ascent, a downward plunge, or a steady sideways drift, with the help of technical analysis.
Today, we will cover all the weapons you should have in your arsenal to analyse a stock like a pro. 🦾
The term "technical analysis" is usually associated with short-term investing, which is also called trading. However, this method of analysing a stock is also essential for people who prefer long-term investing styles instead of trading. I am talking about the kind of investors who like to hold stocks in their portfolios for more than 1-2 years, like Warren Buffett. 😎
There are many different market tools available for technical analysis, each with its own strengths and weaknesses. Let's begin with learning about the…
Most Essential Tools of Technical Analysis
The following tools will help you grab reign on your investing strategy with precision and expertise.
Charts Types
Among the jargon analysts use to portray their investments in stocks, words like candlestick and bar are frequent. If you watch videos of analysts, then you might hear these words all the time. Now, these terminologies represent the many kinds of charts analysts use to understand a stock's movement and then devise their investment strategies.
Many charting software available in the market allow investors and traders to visualise price data in various ways, including line charts, bar charts, and candlestick charts.
/content-assets/d76918afc4094c4d87d6c288e2f1f1ab.jpeg)
- Line charts are the simplest and easiest charting type, which provide a view of a stock's price movement (up, down, or sideways).
- Bar charts are a better option for long-term investors who wish to analyse the stock's movement back to 2-3 years.
- Candlestick charts provide a better idea of a stock's price going higher or lower during each period, along with the representation of the change in number.
You can also use charting software to add technical indicators and overlays to your charts. I have explained these indicators ahead in the article.
Long-term charts, such as weekly or monthly ones, can provide a broader perspective on price trends and patterns, helping investors make decisions that align with their long-term investment goals.
Technical Indicators
A technical indicator is similar to mathematical formulas applied to price data to identify trends, momentum, and other patterns. These are the indicators that open gates to the critical essentials of a stock and help in understanding varying hidden aspects of it. Let's see some examples of technical indicators:
a. Moving Averages:
A tool utilised for the statistical analysis of a stock in a series of times is called moving averages. It describes the average change in the price of a stock, such as the lag of 50-day or 200-day, to gauge the overall direction of an asset.
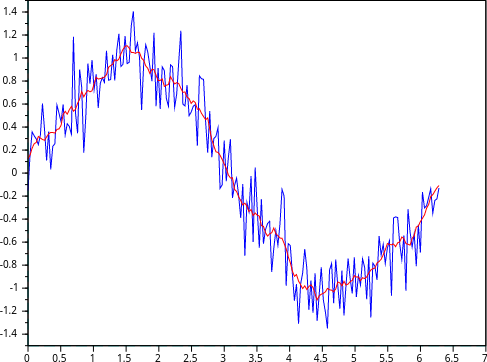
See the upward & downward movements?👆 This price change is what moving averages clarify.
With the help of this tool, investors can smooth out the price data, which in turn helps them to identify the underlying trend. Moving averages are of two types: Simple Moving Averages (SMA) and Exponential Moving Averages (EMA).
Based on the type of moving average you would like to use to analyse a stock, you can understand the trend (upward or downward).
Let's say you want to calculate a 5-day SMA for the closing price of a stock. To do this, you would utilise the formula:
SMA= A1 + A2 + A3 + …… An / n
Where A is the Average in period (price), and n is the Number of periods.
For example, if the closing prices for the past five days were ₹20, ₹22, ₹24, ₹25, and ₹23, then the 5-day SMA would be ₹22.80.
To calculate the trend for EMA, you can use this: ⤵️
/content-assets/cdb91f0de1e149b3bc011c453c95b58f.png)
B. Accumulation/ Distribution Line (A/D):
The Accumulation/Distribution Line (A/D Line) is a technical analysis indicator used to assess money flow into or out of a security/asset. It combines price and volume data to provide insights into the strength of a trend and potential reversal points.
The A/D Line assumes that the accumulation or distribution of security can be inferred by the relationship between its closing price and trading volume. Additionally, the A/D Line is often used with other technical indicators to provide a more comprehensive view of market conditions.
Along with the A/D line, Aroon is another good technical indicator you can utilise for technical analysis.
Momentum Indicators
The term "momentum" here refers to measuring the rate of rise and fall of stock prices. Hence, momentum indicators help determine the strengths and weaknesses of a stock based on its rise or fall trend.
Relative Strength Index (also known as RSI) is a part of the momentum indicator that measures the speed and magnitude of price movements. Simply put, it measures the rate of change of a stock's price. The RSI is used to identify overbought and oversold conditions in a stock's price.
It is calculated as:
/content-assets/949b16e8ed71407293741ca7b6723cf2.png)
Screening Tools
The screening tool is extremely useful and falls under the "never-skip" category I always preach about. There are multiple industries in the market and hundreds of companies listed under these varying sectors. Finding the right stock for your portfolio resembles finding a needle in a haystack. In this scenario, screening platforms help.
Based on your investment goal, you can screen the unnecessary stocks out of your list and focus on analysing the ones with good growth potential.
Screening tools allow you to scan the market for stocks or other assets that meet certain criteria, such as technical indicators (the one we talked about earlier), fundamental data, or chart patterns. This can save you a lot of time and effort when looking for potential trading opportunities.
News and Social Media
I know what you are thinking, "How come social media is included in the technical analysis list?" right? Well, the thing is, we are LIVE-ing in a socially active atmosphere. Social media outlets like Instagram, X, or Facebook are now a great source of information, and it's fast, too.
In addition to market data and technical indicators, it is also essential to stay up-to-date on the latest news and developments in the financial markets. This can help you better understand the factors driving price movements.
Plus, there are many online communities where traders and analysts share ideas and insights about their investing styles and theories. So, along with the usual scrolling, follow some good financial analysts and influencers as well. You never know; you might strike gold with just a click.
You can start from your very own Pranjal Kamra's social media page. Click here to peek inside Kamra's mind and learn the best tips for a successful investing style.
If you want to know the Top 5 Technical Indicators for Stock Analysis, click on the link.
Author's Word of Wisdom
I would like to conclude this article with caution. Remember that having the right weapons in your hand doesn't necessarily mean victory. You must learn how to handle said weapon (in this case, technical analysis tools). Only after knowing the strengths and weaknesses of your weapon-wielding style would you be able to use it to its best ability. ⚔️
So, approach investing in stocks by keeping all the factors in mind. You can refer to the following articles for better understanding:
- 5 Must Check Financial Ratios for Company Analysis
- Don't Overlook These Things Before Investing in a Company
The Bottom Line
Along with the tools mentioned above, there are many software and tools present in the market for investor's discretion. Choosing any of these tools would depend upon the kind of portfolio you possess and your investment style.
If you want to know How to Perform the Technical Analysis of Stocks? Then click on the link.
Have a safe and happy investing!
*Disclaimer: The stocks and companies discussed above aren't a recommendation from Insider by Finology and shall not be construed as a replacement for professional advice. Consult a professional or conduct the necessary research before making investment decisions.
How was this article?
Like, comment or share.
4


